

 Get started
 How-to guides
 Reference
 Concepts
 Self-host gallery
 Appendix
What it shows
- An overall banner: all systems operational, degraded performance, service disruption, or maintenance in progress.
- Each component with its current status and a 90 day uptime bar (one bar per UTC day).
- Active incidents and recent resolved ones (14 days), with their timeline of updates.
- Scheduled and in-progress maintenance, and recently completed maintenance (14 days).
- Links to an RSS feed and a JSON version of the same data.
What it never shows
The public view is a fixed whitelist: page title and description, component public names, statuses, uptime numbers, and the incident and maintenance text you write. It never includes component targets (app names, hostnames, health check URLs), error messages, IDs of internal resources, node names or metrics. A privacy test fails the build if someone adds a field to the public payload without review. Incident and maintenance text is escaped. Only paragraphs, line breaks,- lists, **bold**, `code` and http(s) links are formatted; raw HTML is shown as text.
Set it up
- Dashboard
- CLI
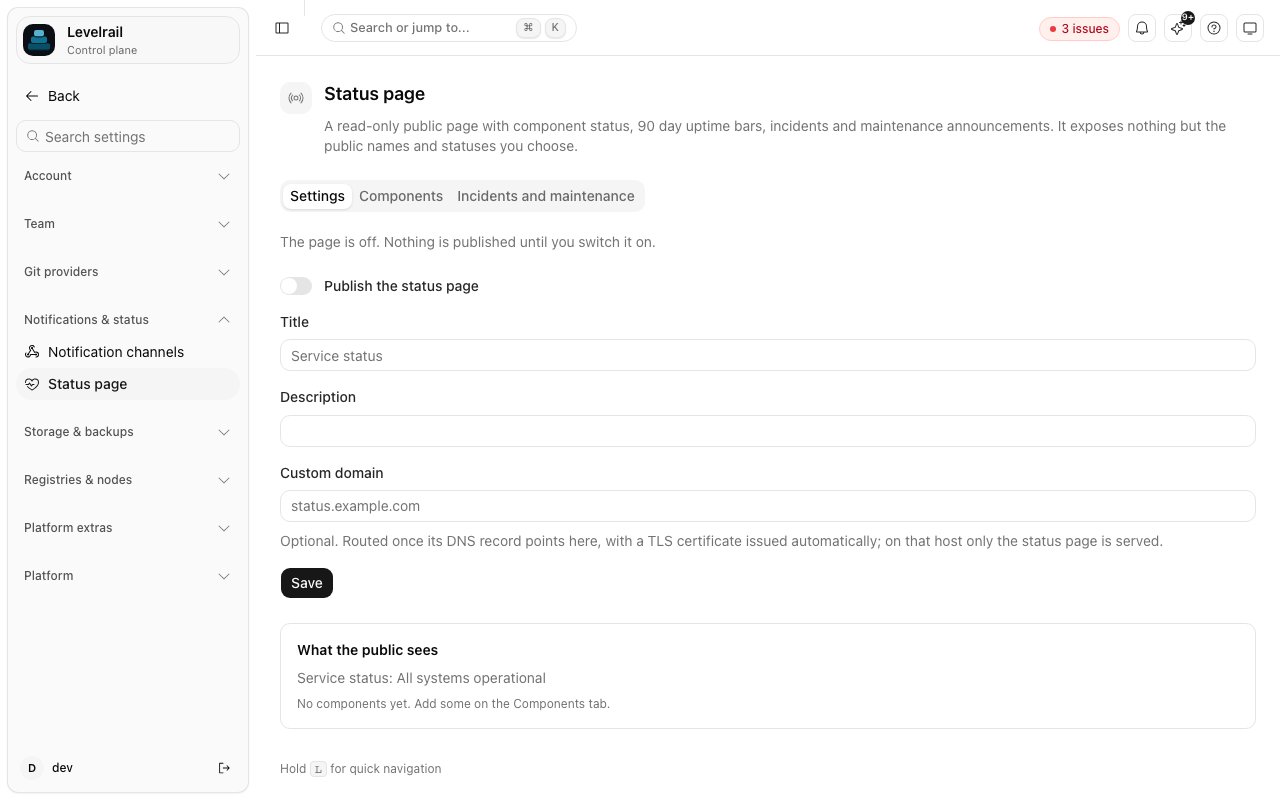
Open Settings, Status page, switch the page on, set a title and description, and add components.
/public/status on the control plane host, with /public/status.json and /public/status.rss next to it.
Component kinds
HTTP checks go through the same SSRF guard as webhooks, so a URL that resolves to a private address is not probed and reports unknown. A component whose status is unknown records no sample and is left out of uptime.
The uptime bars are built from the samples the control plane itself records while the page is enabled (one per component per
APP_STATUS_PAGE_SAMPLE_INTERVAL, default 1m). There is no backfill: days before you enabled the page show as “no data”. A day’s bar is red when at least 5 percent of its samples failed, yellow when some samples failed or were degraded, and green otherwise. Uptime is the share of samples that were not outages.
Incidents and maintenance
Post an incident with an impact (none, minor, major, critical) and the affected components. Minor impact marks those components degraded and major or critical marks them as an outage, on top of what probes report, until the incident is resolved. Each update moves the incident through investigating, identified, monitoring, resolved and is added to its timeline.
Maintenance has a start, an end and a status of scheduled, in_progress or completed. Affected components show as “maintenance” while it is active.
Custom domain
Set a custom domain (status-page set --domain status.example.com) to serve the page at the root of that host. Point its DNS record at this control plane; the domain is routed and its TLS certificate issued automatically, the same as an app domain. On that host only /, /status.json and /status.rss (and the /public/status* paths) are served, and every other path, including the dashboard and the API, returns 404.
Operating it
- Public reads are rate limited per client IP (
APP_STATUS_PAGE_RATE_LIMIT_RPM, default120), and the built view is cached (APP_STATUS_PAGE_CACHE_TTL, default30s). Responses carryCache-Controland anETag, so a CDN or browser can revalidate cheaply. Page responses also carry a restrictive Content-Security-Policy (default-src 'none', inline styles only). - The public routes need no authentication. They are on the public allowlist, with a reason, in the authorization matrix test. Management routes under
/api/v1/status-pageneed thereadorwriteability and are checked against thestatus-pageresource, so an IAM policy can grant or deny them. - Sampling runs only while the page is enabled.
APP_STATUS_PAGE_CHECK_TIMEOUT(default8s) caps each probe. - The environment variables are
APP_STATUS_PAGE_SAMPLE_INTERVAL,APP_STATUS_PAGE_CACHE_TTL,APP_STATUS_PAGE_CHECK_TIMEOUTandAPP_STATUS_PAGE_RATE_LIMIT_RPM. - Rate limiting uses the TCP peer address, and
X-Forwarded-Foris not trusted. Behind a reverse proxy, all visitors share the proxy’s budget, so raise the limit or cache at the proxy.
API
The
get_status_page and list_status_incidents MCP tools are read only. Publishing incidents is deliberately not exposed to MCP, because it posts public text.
Limits
- No subscriber notifications (email or webhook); the RSS feed is the push channel.
- Uptime is measured from this control plane, not from several regions, and covers only the time the page has been enabled.
- One page per control plane.
Related
Observability
Alerts and metrics that run alongside the status page.
Domains and ingress
How a custom status domain is routed and gets a certificate.