

 Get started
 How-to guides
 Reference
 Concepts
 Self-host gallery
 Appendix
Before you start
- A running Levelrail instance and the CLI logged in to it (installing).
- An app that has been running for a few minutes. Any app from the earlier tutorials works.
1
Start with what needs attention
2
Search the logs
Logs are stored on the node and searchable by text and time window:The flags you will use most: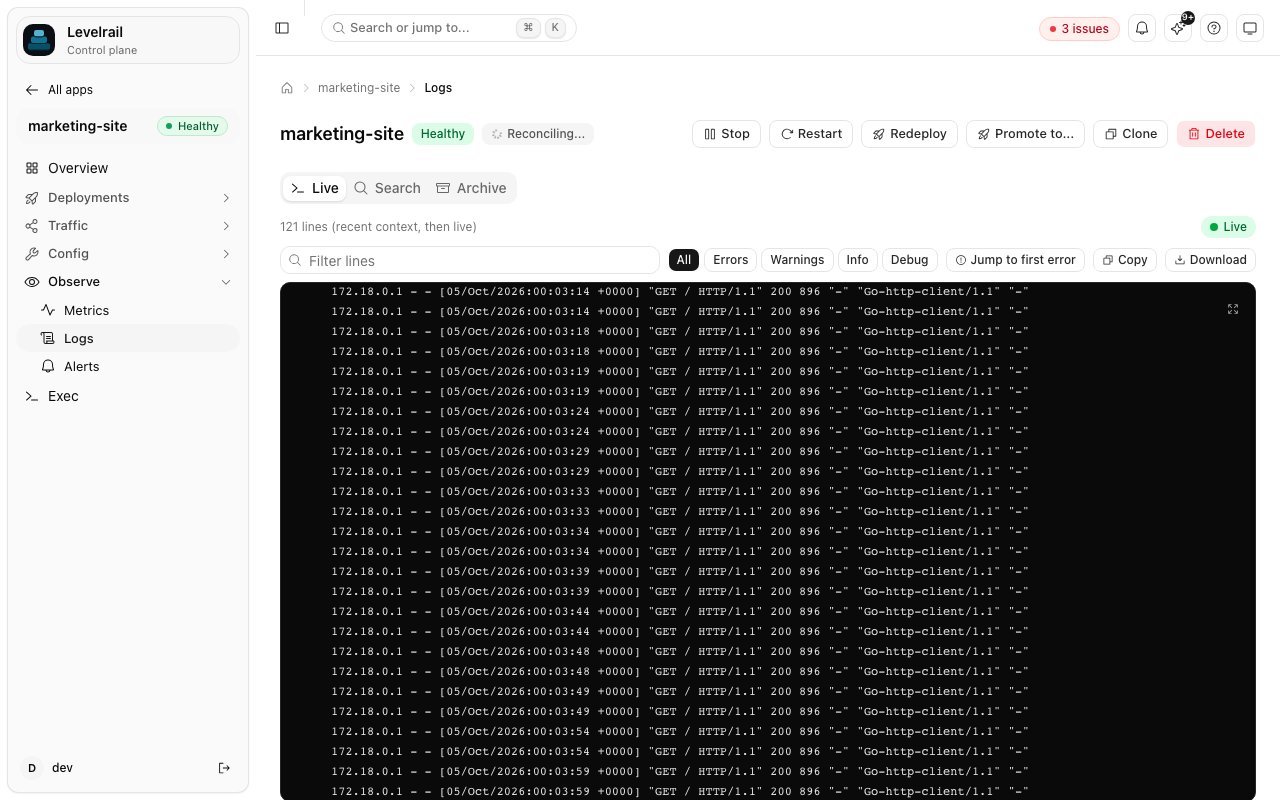
3
Follow live
--follow cannot be combined with --since, --q, or --tail, because it only shows new lines.4
Read CPU and memory
--step. Leave --step off to get the raw samples.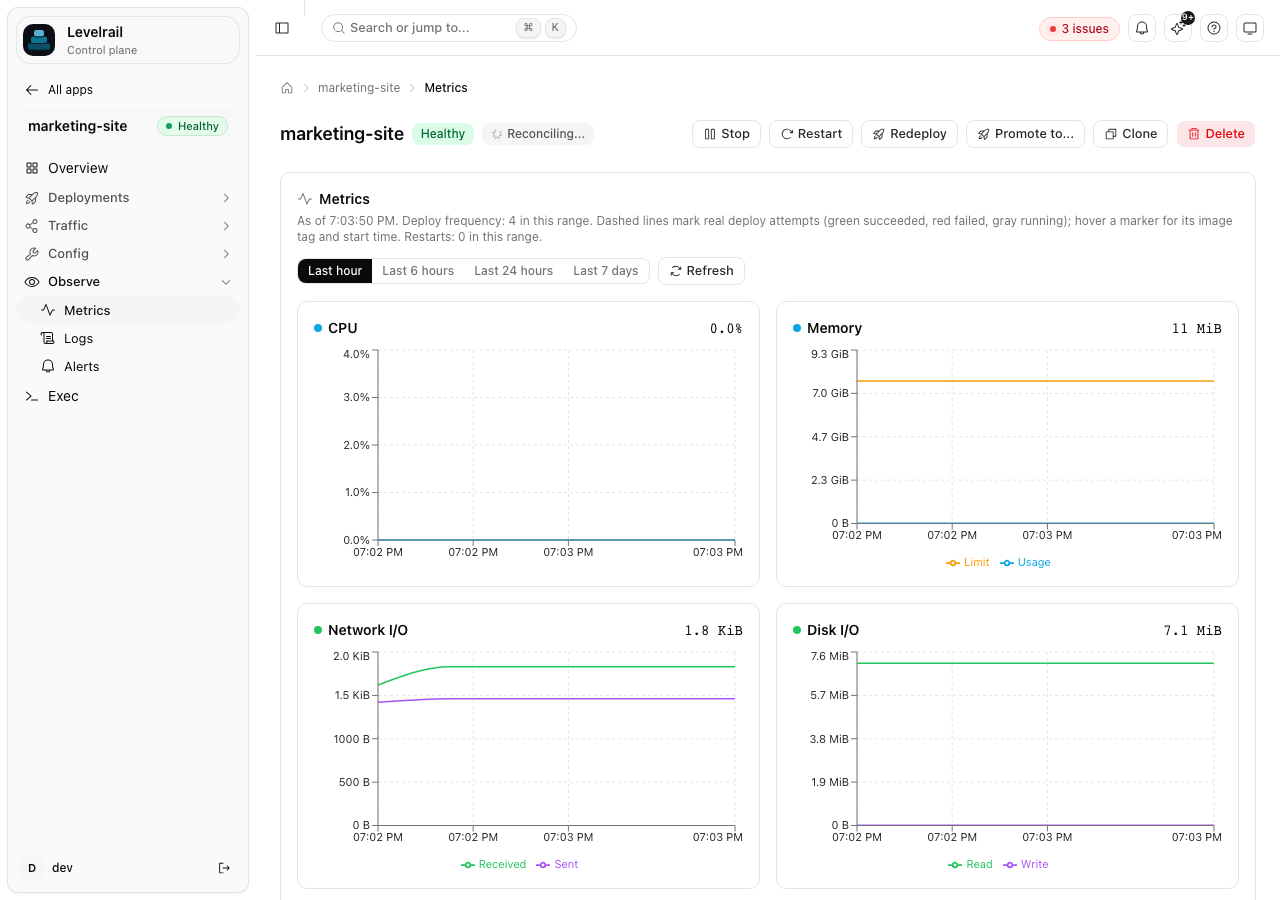
5
Tie it back to deploys
Add an alert so you hear about it first
The health score above flaggedObservability: fail because no alert rules exist. Alerts can go to Slack, Discord, email, Telegram, PagerDuty, ntfy, and other channels. Start with Observability and Email notifications.
Where to go next
- Observability: how the node-local stores work and how retention is set.
- Log archive: keep logs in object storage beyond the local window.
- Zero-downtime deploys with health checks: catch the problem before it ships.