> ## Documentation Index
> Fetch the complete documentation index at: https://docs.levelrail.com/llms.txt
> Use this file to discover all available pages before exploring further.
# Load balancing across replicas
> Balance traffic across an app's replicas with health checks, retries, sticky sessions, weights, graceful cutovers, live upstream status, and Terraform, CDK, CloudFormation or Caddy export.
Set `replicas: 3` and the control plane starts three containers. Any app with more than one replica is balanced across all of them by default: round robin, a replica that fails a request is skipped for 30 seconds, and a failed request is retried on another replica. Set `APP_INGRESS_IMPLICIT_LB=false` to send traffic to the first replica only. To tune the pool (health checks, sticky sessions, weights), use the app's Load balancer tab, the CLI, or `app.yaml`; explicit configuration replaces the default. Balancing uses the same embedded Caddy that terminates TLS for your domains, so no extra container is needed.
```mermaid theme={"dark"}
flowchart LR
Client["Client request"] --> Caddy["Embedded Caddy
reverse_proxy upstream pool"]
Caddy -->|active + passive health checks| R1["Replica 1 (healthy)"]
Caddy -->|active + passive health checks| R2["Replica 2 (healthy)"]
Caddy -.->|held out of pool| R3["Replica 3 (unhealthy / draining)"]
R1 --> Caddy
R2 --> Caddy
Caddy --> Client
```
## Where to find it
* Dashboard, all apps: the **Load balancers** page in the sidebar lists every configured balancer with its state (`balancing`, `degraded`, `none`) and healthy upstream count. With none configured it offers a **Configure a load balancer** button that lets you pick an app.
* Dashboard, one app: the **Load balancer** tab inside an app holds the settings, the live upstream table and the export.
* CLI: `levelrail-cli lb list` for the overview, `levelrail-cli lb show|set|clear|status ` per app.
* API and MCP: `GET /api/v1/loadbalancers` and the `list_load_balancers` tool.
## Enable it
Open the app, then **Load balancer** in the sidebar, then **Set up load balancer**.
```bash theme={"dark"}
levelrail-cli lb set web --algorithm least_conn --health-path /healthz --retries 2
levelrail-cli lb show web
levelrail-cli lb status web
```
```yaml theme={"dark"}
version: 1
services:
web:
build: { type: dockerfile }
port: 3000
domains: [app.example.com]
replicas: 3
loadbalancer:
algorithm: least_conn
active_health: { path: /healthz, interval: 5s, timeout: 2s, passes: 2, fails: 3 }
passive_health: { max_fails: 3, fail_duration: 30s }
retries: { count: 2, try_duration: 5s }
drain_timeout: 15s
```
A deploy that carries a `loadbalancer:` block saves it. A deploy without the block leaves any dashboard or CLI configured balancer alone. To remove one, use **Remove** in the dashboard or `levelrail-cli lb clear web`.
## Algorithms
| Algorithm | Behavior |
| - | - |
| `round_robin` | Each request goes to the next replica in turn. The default. |
| `least_conn` | The replica with the fewest active requests. |
| `ip_hash` | The same client address always reaches the same replica. |
| `uri_hash` | The same path always reaches the same replica. Good for caches. |
| `cookie` | A cookie (`cookie_name`, default `lb`) pins a browser to a replica. New visitors are placed round robin. |
| `weighted` | `weights: [3, 1]` gives replica 0 three quarters of the traffic. Weights are indexed by replica number and default to 1. |
## Health
* Active health checks (`active_health`): Caddy probes each replica's `path` every `interval` and stops sending traffic to one that fails `fails` times in a row until it passes `passes` times. `expect_status` pins an exact status, otherwise any 2xx or 3xx counts.
* Passive health checks (`passive_health`): a replica that fails `max_fails` real requests is skipped for `fail_duration`.
* Retries (`retries`): a failed request is retried on another replica up to `count` times within `try_duration`.
## Deploys
* Drain (`drain_timeout`): open streams (WebSockets, SSE, long downloads) stay up for this long after a cutover instead of being cut when the pool changes.
* Previous release fallback: if none of the new release's replicas is running yet, the pool keeps serving the previous release's containers and reports `ServingPreviousRelease`. Traffic never falls into a gap between blue and green.
* Slow start (`slow_start`, weighted only): a replica that joins the pool ramps from weight 1 to its configured weight over this duration, so a cold container is not hit with a full share at once. A control plane restart does not restart the ramp.
## Limits and TLS
* `request_timeout`: how long to wait for the upstream's response headers.
* `rate_limit: { rps, burst }`: requests per second per client address, enforced before the request reaches any replica.
* `upstream_tls`: speak HTTPS to the replicas. Set `server_name` for certificate verification, or `insecure_skip_verify` for self-signed certificates.
## Replicas on other nodes
The single node case and the multi-node case use the same code path. For a service placed on another node, upstreams are resolved through that node's runtime and addressed by its mesh address (or its node address when it is not on the mesh). The replica's port must be reachable from the control plane, so set `bind_address: public` (or a mesh address) on services you balance across nodes. A replica published on loopback is reported with the note `published on loopback` and left out of the pool.
## Live status
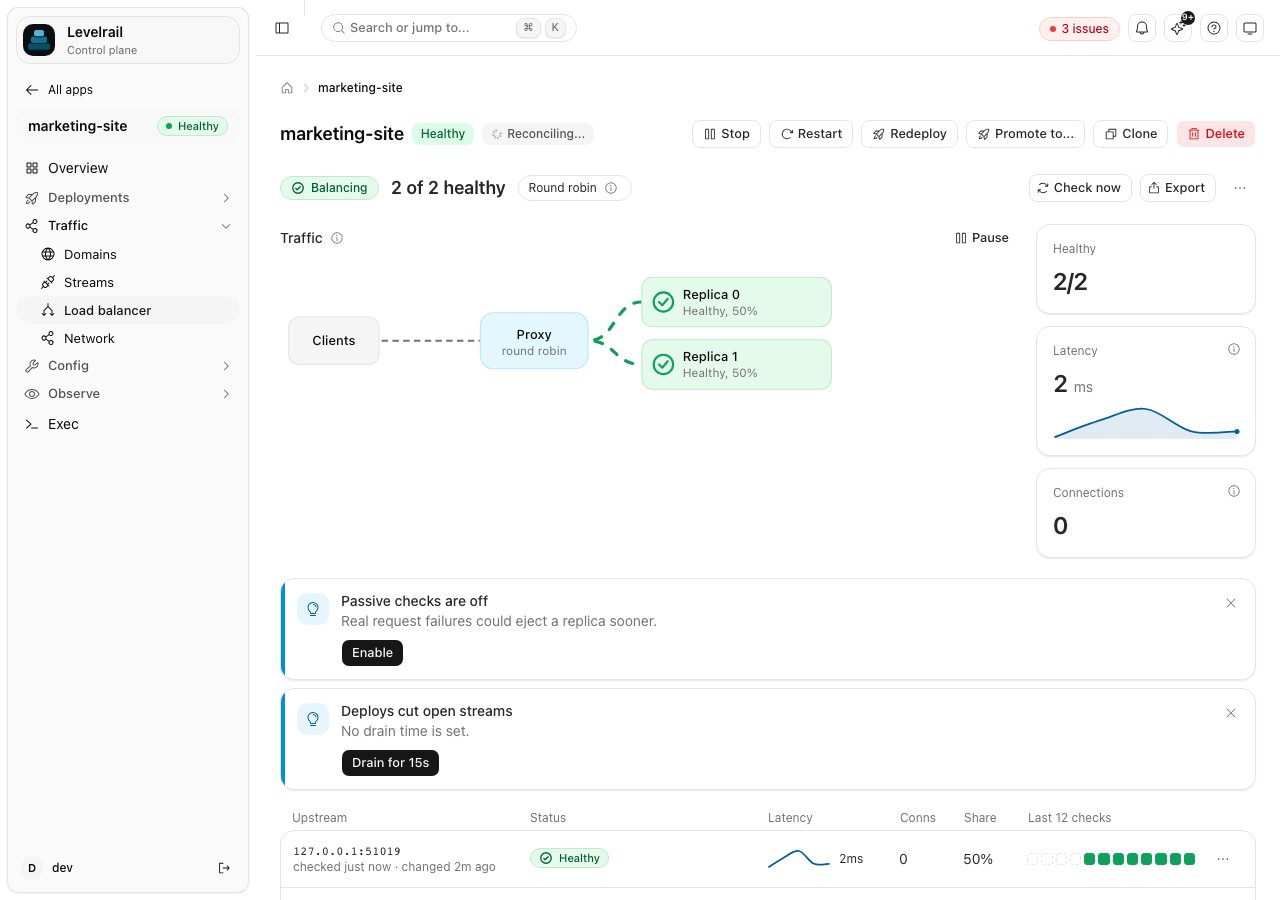 **Load balancer** in the dashboard shows an upstream table refreshed every five seconds: state (`healthy`, `unhealthy`, `draining`), weight, active requests, recent failures, last check time and the reason a replica is out of the pool. The same data is available from `levelrail-cli lb status web`, `GET /api/v1/apps/web/loadbalancer/status`, and the `get_app_load_balancer_status` MCP tool.
The ingress controller reports a `LoadBalancer` condition with these reasons:
| Reason | Meaning |
| - | - |
| `Balancing` | Every replica is in the pool. |
| `UpstreamsDegraded` | Fewer replicas are in the pool than were requested. |
| `ServingPreviousRelease` | Only the previous release's containers are serving. |
| `NoUpstreams` | Nothing is running, so the domain is not routed. |
Metrics `lb_upstreams_total`, `lb_upstreams_healthy` and `lb_active_requests` are recorded per app every 15 seconds and can be charted or alerted on like any other metric.
`GET .../loadbalancer/status` also returns, per upstream, `admin_state`, `reason` for any state other than healthy and `last_changed_at` (when the state last changed, or when the control plane first saw the upstream).
## Check history and transitions
Every health probe result and every state change is recorded per upstream, so you can answer why an upstream went unhealthy after the fact:
```bash theme={"dark"}
levelrail-cli lb history web # recent checks and state changes
levelrail-cli lb history web --json # checks, transitions and 30 minute series
```
`GET /api/v1/apps/web/loadbalancer/history?limit=60` and the `get_load_balancer_history` MCP tool return the same. Each upstream has:
* `checks`: the last 60 probe results (`at`, `ok`, `status_code`, `latency_ms`, `reason`), newest last.
* `transitions`: state changes with a short reason such as `timeout after 2s`, `connection refused`, `expected 200, got 503`, `3 recent failures`, `container not running` or `draining, no new connections`.
* `series`: connections, probe latency and failure counts sampled every 15 seconds over the last 30 minutes.
The history is held in memory and resets when the control plane restarts, which keeps the store small and the write path free of per-probe inserts. Sizes are bounded by `APP_LB_HISTORY_CHECKS` (default 60), `APP_LB_HISTORY_TRANSITIONS` (default 50 per upstream), `APP_LB_HISTORY_STEP` (15s), `APP_LB_HISTORY_WINDOW` (30m) and `APP_LB_HISTORY_MAX_AGE` (24h). Balancers without an `active_health` block record transitions and series but no probe results, because no probe runs on them in the background.
## Check now
```bash theme={"dark"}
levelrail-cli lb check web
```
`POST /api/v1/apps/web/loadbalancer/check` (and the `check_load_balancer` MCP tool) probes every running upstream once, in parallel, with the configured active health check and records the results in the history. When the balancer has no active health check, it probes `GET /` with a 2 second timeout (`APP_LB_CHECK_TIMEOUT`) and says so in a `note` field. Checks are limited to one per app per 2 seconds (`APP_LB_CHECK_MIN_INTERVAL`); a faster call gets `429` with `Retry-After`. A check changes no configuration.
## Per-upstream admin state
```bash theme={"dark"}
levelrail-cli lb upstream web web#1 --state draining
levelrail-cli lb upstream web web#1 --state disabled
levelrail-cli lb upstream web web#1 --state active
```
`PUT /api/v1/apps/web/loadbalancer/upstreams/{id}` (and the `set_load_balancer_upstream_state` MCP tool) sets one replica to:
| State | Effect |
| - | - |
| `active` | Normal. The default; clears the setting. |
| `draining` | Removed from the ingress pool on the next reconcile, so it gets no new connections. Requests in flight finish, and open streams stay up for the balancer's `drain_timeout`. Shown as `draining`. |
| `disabled` | Removed from the ingress pool the same way and shown as `disabled`. Use it for maintenance you expect to last. |
Caddy has no per-upstream drain flag, so both states work by leaving the upstream out of the generated pool; the difference is how it is reported and what you intend. The setting is stored per app and replica index, survives restarts, is removed with the app, and is re-applied on every reconcile, so a failed apply is retried until the pool matches. If every running replica is drained or disabled the domain is left unrouted (`NoUpstreams`), so check the pool before draining the last replica. Balancing then reports `UpstreamsDegraded` with the number held out.
## Export as infrastructure as code
**Export** in the dashboard, or:
```bash theme={"dark"}
levelrail-cli lb export web --format terraform --out web-lb.tf
levelrail-cli lb export web --format cdk
levelrail-cli lb export web --format cloudformation
levelrail-cli lb export web --format caddy
```
Formats: `terraform` (AWS ALB, target group, listener), `cdk` (AWS CDK TypeScript), `cloudformation` (YAML), `caddy` (Caddyfile) and `caddy-json`. Export is text generation only and never calls a cloud API. Settings that ALB cannot express (`ip_hash`, `uri_hash`, passive health, retries, rate limits) are printed as warnings rather than silently dropped. Values that ALB limits, such as health check intervals of 5 to 300 seconds, are clamped into range.
`levelrail-cli lb import web --file app.yaml` loads the `loadbalancer:` block of an `app.yaml` (from `--service` if the app name differs) into a running app.
## Not included
* Layer 4 (TCP) balancing. This is HTTP only.
* A separate balancer node in front of the control plane. The control plane's ingress is the balancer.
* Autoscaling. Replica count is still yours to set.
## See also
* [Domains and ingress](/domains-and-ingress): the embedded Caddy that does the balancing, and how a backend outage is handled.
* [Multi-node](/multi-node#routing-to-apps-on-remote-nodes): how replicas on other nodes are reached.
This documentation is built and hosted on [Mintlify](https://mintlify.com), a developer documentation platform.
**Load balancer** in the dashboard shows an upstream table refreshed every five seconds: state (`healthy`, `unhealthy`, `draining`), weight, active requests, recent failures, last check time and the reason a replica is out of the pool. The same data is available from `levelrail-cli lb status web`, `GET /api/v1/apps/web/loadbalancer/status`, and the `get_app_load_balancer_status` MCP tool.
The ingress controller reports a `LoadBalancer` condition with these reasons:
| Reason | Meaning |
| - | - |
| `Balancing` | Every replica is in the pool. |
| `UpstreamsDegraded` | Fewer replicas are in the pool than were requested. |
| `ServingPreviousRelease` | Only the previous release's containers are serving. |
| `NoUpstreams` | Nothing is running, so the domain is not routed. |
Metrics `lb_upstreams_total`, `lb_upstreams_healthy` and `lb_active_requests` are recorded per app every 15 seconds and can be charted or alerted on like any other metric.
`GET .../loadbalancer/status` also returns, per upstream, `admin_state`, `reason` for any state other than healthy and `last_changed_at` (when the state last changed, or when the control plane first saw the upstream).
## Check history and transitions
Every health probe result and every state change is recorded per upstream, so you can answer why an upstream went unhealthy after the fact:
```bash theme={"dark"}
levelrail-cli lb history web # recent checks and state changes
levelrail-cli lb history web --json # checks, transitions and 30 minute series
```
`GET /api/v1/apps/web/loadbalancer/history?limit=60` and the `get_load_balancer_history` MCP tool return the same. Each upstream has:
* `checks`: the last 60 probe results (`at`, `ok`, `status_code`, `latency_ms`, `reason`), newest last.
* `transitions`: state changes with a short reason such as `timeout after 2s`, `connection refused`, `expected 200, got 503`, `3 recent failures`, `container not running` or `draining, no new connections`.
* `series`: connections, probe latency and failure counts sampled every 15 seconds over the last 30 minutes.
The history is held in memory and resets when the control plane restarts, which keeps the store small and the write path free of per-probe inserts. Sizes are bounded by `APP_LB_HISTORY_CHECKS` (default 60), `APP_LB_HISTORY_TRANSITIONS` (default 50 per upstream), `APP_LB_HISTORY_STEP` (15s), `APP_LB_HISTORY_WINDOW` (30m) and `APP_LB_HISTORY_MAX_AGE` (24h). Balancers without an `active_health` block record transitions and series but no probe results, because no probe runs on them in the background.
## Check now
```bash theme={"dark"}
levelrail-cli lb check web
```
`POST /api/v1/apps/web/loadbalancer/check` (and the `check_load_balancer` MCP tool) probes every running upstream once, in parallel, with the configured active health check and records the results in the history. When the balancer has no active health check, it probes `GET /` with a 2 second timeout (`APP_LB_CHECK_TIMEOUT`) and says so in a `note` field. Checks are limited to one per app per 2 seconds (`APP_LB_CHECK_MIN_INTERVAL`); a faster call gets `429` with `Retry-After`. A check changes no configuration.
## Per-upstream admin state
```bash theme={"dark"}
levelrail-cli lb upstream web web#1 --state draining
levelrail-cli lb upstream web web#1 --state disabled
levelrail-cli lb upstream web web#1 --state active
```
`PUT /api/v1/apps/web/loadbalancer/upstreams/{id}` (and the `set_load_balancer_upstream_state` MCP tool) sets one replica to:
| State | Effect |
| - | - |
| `active` | Normal. The default; clears the setting. |
| `draining` | Removed from the ingress pool on the next reconcile, so it gets no new connections. Requests in flight finish, and open streams stay up for the balancer's `drain_timeout`. Shown as `draining`. |
| `disabled` | Removed from the ingress pool the same way and shown as `disabled`. Use it for maintenance you expect to last. |
Caddy has no per-upstream drain flag, so both states work by leaving the upstream out of the generated pool; the difference is how it is reported and what you intend. The setting is stored per app and replica index, survives restarts, is removed with the app, and is re-applied on every reconcile, so a failed apply is retried until the pool matches. If every running replica is drained or disabled the domain is left unrouted (`NoUpstreams`), so check the pool before draining the last replica. Balancing then reports `UpstreamsDegraded` with the number held out.
## Export as infrastructure as code
**Export** in the dashboard, or:
```bash theme={"dark"}
levelrail-cli lb export web --format terraform --out web-lb.tf
levelrail-cli lb export web --format cdk
levelrail-cli lb export web --format cloudformation
levelrail-cli lb export web --format caddy
```
Formats: `terraform` (AWS ALB, target group, listener), `cdk` (AWS CDK TypeScript), `cloudformation` (YAML), `caddy` (Caddyfile) and `caddy-json`. Export is text generation only and never calls a cloud API. Settings that ALB cannot express (`ip_hash`, `uri_hash`, passive health, retries, rate limits) are printed as warnings rather than silently dropped. Values that ALB limits, such as health check intervals of 5 to 300 seconds, are clamped into range.
`levelrail-cli lb import web --file app.yaml` loads the `loadbalancer:` block of an `app.yaml` (from `--service` if the app name differs) into a running app.
## Not included
* Layer 4 (TCP) balancing. This is HTTP only.
* A separate balancer node in front of the control plane. The control plane's ingress is the balancer.
* Autoscaling. Replica count is still yours to set.
## See also
* [Domains and ingress](/domains-and-ingress): the embedded Caddy that does the balancing, and how a backend outage is handled.
* [Multi-node](/multi-node#routing-to-apps-on-remote-nodes): how replicas on other nodes are reached.
This documentation is built and hosted on [Mintlify](https://mintlify.com), a developer documentation platform.